
Source: Press Information Bureau (PIB), Government of India — Ministry of Statistics and Program Implementation PIB Delhi Read the original release on pib.gov.in
- 'Buses (55.8 percent) and trains (17.7 percent) contribute the most to domestic night trips.'
- 'Leading role of two-wheelers in workforce mobility'
Headlines
|
The National Statistical Office (NSO) under the Ministry of Statistics and Program Implementation conducted the survey from July 2025 to June 2026. First National Household Travel Survey (NHTS)) Key indicators and findings have been released through a factsheet. For the purpose of the survey, a trip is defined as a journey covering a distance of more than 1 kilometre.
Primary objectives of survey
The primary objective of this survey is to obtain robust, data-based information about domestic travel patterns and mobility to support regional transportation planning, infrastructure development and evidence-based policy making. The survey covers key aspects of domestic travel, including:
- Purpose of travel: employment, education, social activities, cultural and recreational activities, tourism, household chores, caregiving and other purposes.
- Mode of Transportation: Modes of transportation used by different demographic groups to travel.
- Trip duration and distance: Average time taken and distance traveled during trips.
Apart from meeting the specific data requirements of the Ministry of Railways, this survey ways people travel, time and reasons Hope to get valuable information about. Information collected on travel patterns and use of public transport will be helpful in identifying deficiencies in existing transport systems, assessing accessibility, optimizing transport routes and improving service frequency and schedules. Its findings will also provide an important evidence base for regional transport planning, investment in infrastructure and the formulation of conscious transport policies.
major findings
The key findings of the NHTS on four central aspects of commuting are summarized below, namely, (i) commuting, (ii) duration and peak hours, (iii) expenditure involved, and (iv) night and non-work travel.
student traffic
- 66.4 percentage students per day 1 travels more than km: Nearly two-thirds of students aged 6 years and above travel at least 1 km in a single day to attend their primary course of instruction (65.6 percent in rural areas; 68.1 percent in urban areas). Records of journeys of less than one kilometer were not maintained. Travel time in the North Eastern states including Assam and neighboring states is quite short (15 to 19 minutes).
- youth (15-29 year) in 77.0 percentage Peak Traffic: Students aged 15-29 years report the highest regular travel participation for daily commute to educational institutions at 79.1 per cent in rural India and 73.3 per cent in urban India.
- tops used for school trips 3 The means are: Walking (37.0 percent), buses (29.5 percent), and bicycles (15.8 percent). These three modes account for the vast majority of student mobility across the country.
- Auto-rickshaws and two-wheelers in transportation of students: Overall, 10.5 per cent of students commuting use auto-rickshaws (this figure increases to 14.4 per cent in urban areas), while two-wheelers account for 6.7 per cent (11.5 per cent in urban areas).
workforce mobility
- 57.6 percentage workers to go to work 1 travels more than km: More than half of workers aged 15 years and above travel within a commuting day to fixed or indefinite workplaces (54.5 percent rural vs. 64.1 percent urban).
- The average travel time in states like Rajasthan, Gujarat and Madhya Pradesh is around 20-23 minutes, while in some parts of South India the travel time is longer.
- Gender gap in workforce travel: Across the country, 61.9 per cent of male employees travel to work for more than 1 km per day, while the percentage of female employees is 41.9 per cent.
- 42.6 percentage Workers ride two-wheelers: Two-wheelers are the largest primary mode of transportation for workers across India (37.1 percent rural; 52.3 percent urban).
- Major centers of urban mass transport: While the share of monorail, metro, suburban rail and tram in urban workers' commute at the national level is 5.0 per cent, its usage increases in Maharashtra (20.7 per cent), West Bengal (16.5 per cent) and Delhi (14.4 per cent).
Travel duration and peak times
- to go to school 23 minutes | to go to work 25 minutes: The average travel time from origin for students is 23 minutes (23 minutes in rural areas; 22 minutes in urban areas) and 25 minutes for workers traveling to a fixed workplace (23 minutes in rural areas; 27 minutes in urban areas).
- 87.6 percentage Student 30 Reach within minutes: Nearly 9 in 10 students complete their journey to educational institutions within 30 minutes (86.6 per cent rural; 89.6 per cent urban).
- 83.4 percentage Employee 30 Get to work in less than minutes: More than four-fifths of workers reach their designated workplace within half an hour (86.1 percent rural; 79.3 percent urban), while 13.7 percent take 30–60 minutes.
- 82.0 percentage student morning 7:00 from o'clock 10:00 Departs between: The peak school departure time is between 8:00 – 9:00 am (35.7 percent), followed by 7:00 – 8:00 am (26.6 percent) and 9:00 – 10:00 am (19.7 percent).
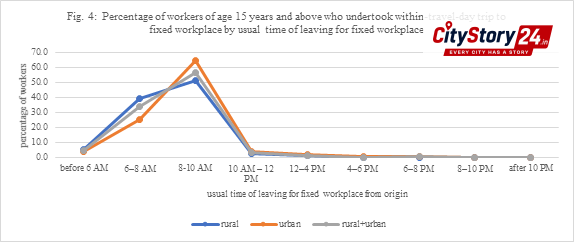
- 94.9 percentage staff morning 10:00 Let's leave before o'clock: For permanent workplaces, morning occupancy peaks between 8:00 – 10:00 am (56.5 percent) and 6:00 – 8:00 am (33.7 percent), with 4.7 percent of workers leaving before 6:00 am.
monthly commuting expenses
- Average commuting cost of students – 443 Rs./Month: Urban students spend an average of Rs 617 per month on commuting to educational institutions, compared to Rs 361 per month in rural India.
- Average labor commuting cost – 785 Rs. /Month: Workers commuting to a fixed workplace spend Rs 1044 per month in urban areas and Rs 612 per month in rural areas.
- Gender disparity in workers' travel expenses: Male workers spend an average of Rs 835 per month on commuting to work, while female workers spend Rs 533 per month.
Overnight and non-work travel
- of overnight trips 73.5 percentage Depend on bus and rail: Buses (55.8 percent) and inter-city trains (17.7 percent) are the primary modes of domestic overnight travel, followed by cars (15.1 percent) and two-wheelers (8.8 percent).
- from urban families 22.7 percentage For overnight journeys choose Rail: Railway usage for overnight trips is about 14.0 per cent among rural households and about 22.7 per cent among urban households.
- of night trips 70.2 percentage Social and religious: Social interaction, communication and religious activities motivate the overwhelming majority of night-time domestic trips (69.7 percent rural; 70.9 percent urban).
- Tourism and health in night travel : Culture, leisure, sports and tourism account for 7.4 percent of overnight domestic trips (9.3 percent in urban areas), while self-care and maintenance account for 6.5 percent (7.6 percent in rural areas).
- Other daily trips – two-wheelers, Walking and auto at the forefront: For intraday trips other than education and employment, citizens mainly use two-wheelers (32.2 percent), walking (24.9 percent), auto-rickshaws (18.9 percent), bicycles (12.6 percent), and buses (8.5 percent).
Estimates of indicators of the relevant parameters at all India level for both rural and urban areas are given in the attached appendix.
appendix
Key features and conceptual framework of the survey
In this survey, the distance traveled by Indian citizens of one kilometer or more Data related to regular visits were collected. The objective was to gather information about the mode of transport used by them, purpose of travel, frequency of travel, average expenditure on regular trips and other relevant parameters. This nationwide survey covering rural and urban areas of all states and union territories of India will prove to be a comprehensive benchmark to understand the characteristics of travel behavior of households in the country.
The following new concepts have been introduced in this first All India Survey.
- in nhts ‘Travel‘ Means to cover only a distance of one kilometer or more. Any journey of less than one kilometer will be registered in NHTS as ‘Travel‘ Is not considered.
- ‘primary mode of travel‘ Means any means of transport used to cover the longest distance during a journey. If a journey is completed using only one mode of transport, that would undoubtedly be the primary mode.
- Travel Day: For all purposes of the Domestic Travel Survey, travel day shall mean the period from 3:00 a.m. of one calendar day to 2:59 a.m. of the next calendar day.
- Trips during travel day: Trips that end any time during the travel day and do not keep family members away from their residence for more than 24 hours are considered trips during the travel day. Such journeys may last for a maximum of two consecutive journey days.
- Night Trip: A journey in which a family member stays away from his residence for more than 24 hours will be considered as night travel. This will include the time of journey and period of stay (if any) during the journey. However, such journeys of a distance of less than 50 kilometers will not be considered as night journey even if it results in the family member being away from his residence for more than 24 hours.
Estimation of indicators of travel characteristics
Table (1): Percentage of students aged 6 and above traveling within the travel day to attend an educational institution related to the basic curriculum (as per CWS). | |||||||||
Sector | Percentage of students in that age group traveling during the travel day | ||||||||
Male | Woman | Person | |||||||
6-14 years | 15-29 years | 6 years and above | 6-14 years | 15-29 years | 6 years and above | 6-14 years | 15-29 years | 6 years and above | |
Rural | 60.4 | 79.3 | 66.8 | 57.4 | 78.8 | 64.2 | 59.0 | 79.1 | 65.6 |
urban | 65.3 | 73.2 | 68.6 | 63.4 | 73.5 | 67.5 | 64.4 | 73.3 | 68.1 |
rural+urban | 61.8 | 77.2 | 67.3 | 59.1 | 76.8 | 65.2 | 60.6 | 77.0 | 66.4 |
Table (2): Percentage of students aged 6 years and above who travel on a single day to attend an educational institution related to the basic curriculum who use different primary modes of transport. | |||
primary mode of travel | Percentage of students of that age group traveling to an educational institution out of the total number of students traveling on the same day. | ||
6-14 years | 15-29 years | 6 years and above | |
on foot | 47.3 | 22.2 | 37.0 |
Bicycle | 11.9 | 21.4 | 15.8 |
cycle rickshaw/pull rickshaw | 0.2 | 0.2 | 0.2 |
two wheeler | 5.1 | 9.0 | 6.7 |
car | 0.5 | 0.9 | 0.7 |
auto rickshaw | 7.7 | 14.6 | 10.5 |
Bus | 28.4 | 31.0 | 29.5 |
Train/Monorail/Tram | 0.1 | 1.7 | 0.8 |
Rail | 0.0 | 0.3 | 0.1 |
waterways | 0.0 | 0.0 | 0.0 |
Other | 0.1 | 0.0 | 0.1 |
Table (3): Percentage of workers aged 15 years and above traveling within a travel day to fixed or indefinite workplaces in different States/UTs (as per CWS). | ||||
Sector | Male-Female | Percentage of workers in that age group traveling within the travel day to fixed/indefinite workplace | ||
15-29 years | 15 – 59 years | 15 years and above | ||
Rural | Male | 57.7 | 61.0 | 59.6 |
Rural | Woman | 34.3 | 38.0 | 37.7 |
Rural | Person | 53.4 | 55.6 | 54.5 |
urban | Male | 66.7 | 67.7 | 66.6 |
urban | Woman | 60.3 | 53.9 | 52.9 |
urban | Person | 65.5 | 65.1 | 64.1 |
rural+urban | Male | 60.7 | 63.3 | 61.9 |
rural+urban | Woman | 43.5 | 42.5 | 41.9 |
rural+urban | Person | 57.5 | 58.7 | 57.6 |
Table (4): Percentage of workers aged 15 years and above who travel to fixed/unfixed locations of work and use different primary modes of transport during the travel day. | |||
primary means of transportation | Percentage of workers traveling to fixed/undetermined locations during travel day | ||
Rural | urban | rural+urban | |
on foot | 36.6 | 13.5 | 28.3 |
Bicycle | 13.4 | 5.8 | 10.7 |
cycle rickshaw/pull rickshaw | 0.2 | 0.2 | 0.2 |
two wheeler | 37.1 | 52.3 | 42.6 |
car | 1.5 | 5.7 | 3.0 |
auto rickshaw | 5.0 | 8.8 | 6.4 |
Bus | 5.3 | 9.2 | 6.7 |
Train/Monorail/Tram | 0.4 | 5.0 | 2.1 |
Rail | 0.2 | 0.3 | 0.2 |
waterways | 0.0 | 0.0 | 0.0 |
Other | 1.4 | 0.3 | 1.0 |
Table (5): Percentage of persons aged 6 years and above who traveled for various purposes (except attending a basic curriculum educational institution and employment) during the travel day who reported such trips. | |||
purpose of travel | Percentage of persons traveling within a travel day by purpose of travel | ||
Rural | urban | rural+urban | |
Searching for employment/setting up a business | 0.5 | 0.4 | 0.5 |
production of goods for one's own use | 2.0 | 1.5 | 1.8 |
Unpaid domestic services for household members | 51.5 | 60.1 | 54.1 |
Unpaid care services for family members | 2.2 | 2.2 | 2.2 |
unpaid volunteering, training, work | 0.2 | 0.2 | 0.2 |
teaching | 1.0 | 1.3 | 1.1 |
Social interaction, communication and religious activities | 6.4 | 7.5 | 6.8 |
Culture, leisure, sports practice, tourism | 0.7 | 1.4 | 0.9 |
Self Care and Maintenance | 4.4 | 5.0 | 4.6 |
returning home from outdoor activity | 99.3 | 99.6 | 99.4 |
Note: Estimates of some parameters in one or more of the above tables ‘Zero‘ is shown as, Because insignificant values have been converted to integers.
Ministry of Statistics and Program Implementation QR to view publications/reports of Scan the code.
This is the official press release issued by the Press Information Bureau (PIB), and is published without changes.